

MONITORING
Server and network monitoring
A failing disk or a saturated link is cheap to fix when you hear about it early. Razban sets up monitoring on your infrastructure, so your IT team sees every server and network device on one dashboard and gets an alert before users start calling.
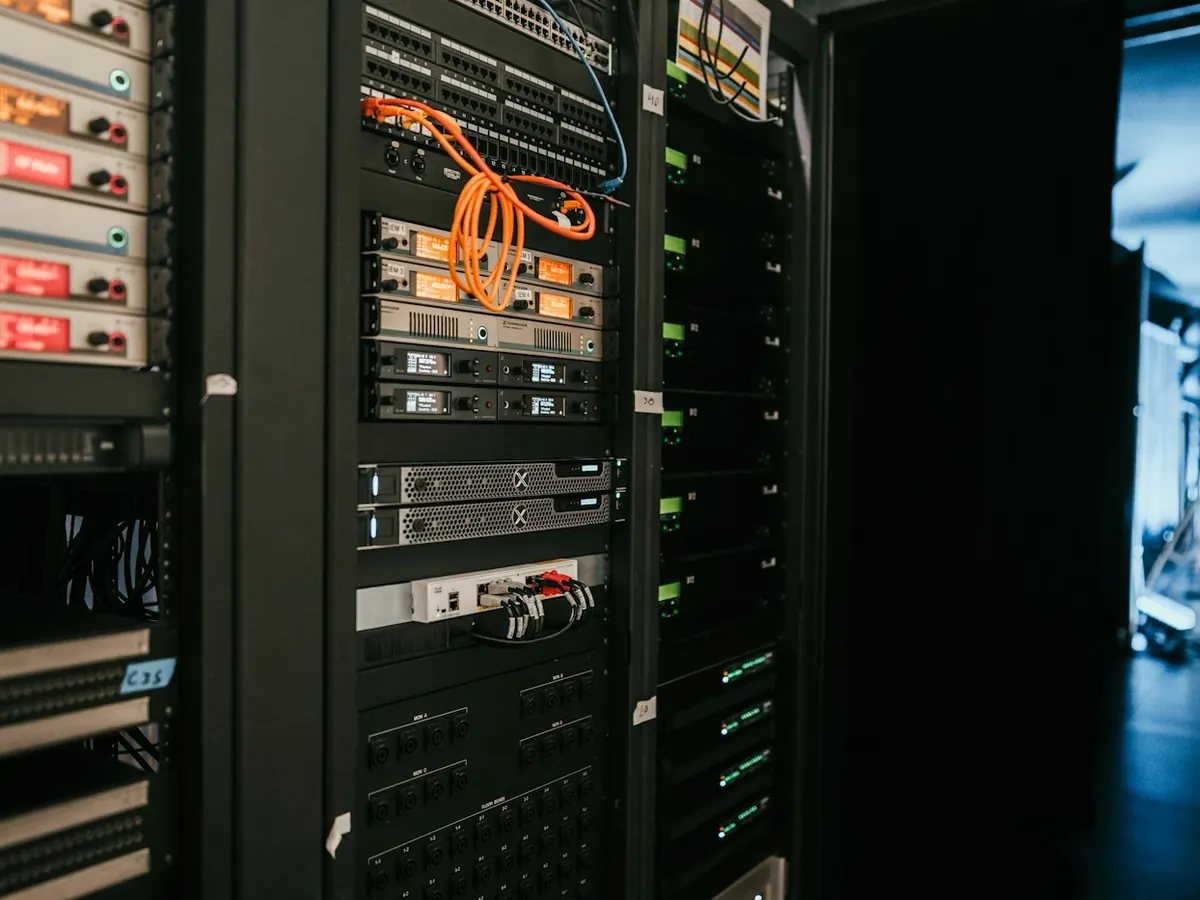
Scope of the monitoring setup
What we monitor
- Servers
- Network equipment
- Services and their log sources
What you receive
- Zabbix and Splunk deployed on your own infrastructure
- A status dashboard for servers, network and services
- Alert thresholds and rules with named recipients
Suited to
- IT teams that need to see an outage before users report it
- Organizations with servers and network equipment on site
- Teams that need availability monitoring alongside a SOC
Rolling out monitoring
- 1
Inventory
We list the servers, network devices and services that need watching, and which of them are critical.
- 2
Deployment
Zabbix and Splunk are installed and connected to each device and service.
- 3
Alert rules
Thresholds are set for each check, and alerts are routed to the people who will act on them.
- 4
Dashboard handover
Your IT team gets one dashboard for the whole estate.
Frequently asked questions
What does each of Zabbix and Splunk do?
Zabbix watches the status and performance of servers, network devices and services, and raises an alert when a threshold is crossed. Splunk collects logs from different sources so they can be searched and reviewed in one place.
Who receives the alerts?
The recipients for each service's alerts are agreed with your IT team during deployment.
How is monitoring different from a SOC?
Monitoring tells you whether servers, networks and services are up and performing. A security operations center looks at the same infrastructure for signs of attack and responds to security incidents. Many organizations run both.
Monitoring deployment
Tell us how many servers, network devices and critical services you run, and we will propose a monitoring setup.